
01Thesis
FOMO is measurable. A coin prints a new high, search traffic doubles, funding goes vertical, takers lift every offer, Fear and Greed reads above 80. If late buyers are dumb money, fading them should pay. If the crowd is early to a trend, riding should pay. Either is a testable claim, and both have to clear fees, slippage and funding.
The second claim is the one people actually ask about: that the traders posting a 1,000 to 111,000 day in the meme coin trenches have a repeatable method. We sampled launches at creation, so dead coins count, and followed the wallets that traded them.
02Data that worked, and data that did not
# endpoint probe from the research box, 7 Oct 2026 02:13 AZ
for url in ENDPOINTS: print(status(url), url)200 data.binance.vision 1h klines, funding, 5m metrics (OI, long/short, taker)
200 alternative.me fng Fear & Greed, full daily history
200 Google Trends (pytrends) weekly, 5 years
200 yfinance GME, AMC, SPY daily
200 pump.fun frontend-api-v3 newest launches incl. twitter / website / telegram links
200 pump.fun swap-api v2 per-token trades (cursor) and 1m candles
200 kolscan.io leaderboard top 50 KOL wallets, 1d / 7d / 30d
429 Dexscreener, GeckoTerminal rate limited on first call
403 gmgn.ai blocked
401 Birdeye needs a key
451 fapi.binance.com geo blocked (archive used instead)
403 api.bybit.com geo blockedX follower counts and account age were not obtainable without an authenticated API. The study uses what the token metadata says at launch: whether an X link exists and what kind of link it is (a profile, a single post, or a community), whether a website exists, and whether a Telegram link exists.
03Liquid FOMO on perpetuals
36 Binance USDT-margined listings (35 assets; RNDR and RENDER are one token across a rename), hourly bars from July 2023 to September 2026. Ten triggers, one event per symbol per trigger per 72 hours. Entry at the trigger bar close. Cost 14 basis points round trip (5 bp taker each side plus 2 bp slippage each side, an estimate at the base fee tier) plus the actual funding paid or received.
triggers = {
  "30d_high_break":      close > max(high, 720 bars),
  "sample_ath_break":    close > every prior high since Jul 2023,
  "pump_24h_20pct":      24h return > 20%,
  "taker_buy_spike":     taker buy share > 60% and volume > 3x 30d median,
  "funding_ge_0.05pct":  8h funding >= 0.05%,
  "fear_greed_gt_80":    daily index > 80,
  "gtrends_2x":          weekly searches >= 2x trailing 12w mean (BTC, DOGE, SOL),
  "oi_24h_up_25pct":     open interest +25% in 24h        # metrics: last 240 days only
  "ls_ratio_top5pct":    long/short accounts > rolling 95th pct
  "taker_ratio_top5pct": taker long/short volume > rolling 95th pct
}
direction = argmax(ride, fade) on in-sample only     # holdout from 2025-07-01
ci = bootstrap(events, cluster="calendar week") # 2,000 draws6,148 events across 10 triggers and 5 horizons| trigger | hold | n in | n out | picked | in-sample net | holdout net | holdout minus basket | 95% CI |
|---|---|---|---|---|---|---|---|---|
| 30d_high_break | 1h | 827 | 420 | ride | -0.01% | -0.24% | -0.20% | -0.35 to -0.05 |
| 30d_high_break | 4h | 827 | 420 | ride | +0.16% | -0.07% | -0.17% | -0.48 to +0.09 |
| 30d_high_break | 24h | 827 | 420 | ride | +0.65% | +0.32% | +0.36% | -0.26 to +1.19 |
| 30d_high_break | 72h | 827 | 420 | ride | +2.52% | +0.08% | +0.41% | -0.29 to +1.24 |
| 30d_high_break | 168h | 827 | 420 | ride | +5.24% | -0.76% | +0.19% | -0.66 to +1.21 |
| fear_greed_gt_80 | 1h | 273 | 280 | ride | +0.10% | -0.68% | n/a (market-wide) | n/a |
| fear_greed_gt_80 | 4h | 273 | 280 | fade | -0.10% | -0.86% | n/a (market-wide) | n/a |
| fear_greed_gt_80 | 24h | 273 | 280 | ride | +3.12% | +0.25% | n/a (market-wide) | n/a |
| fear_greed_gt_80 | 72h | 273 | 280 | ride | +3.35% | +1.56% | n/a (market-wide) | n/a |
| fear_greed_gt_80 | 168h | 273 | 280 | ride | +7.41% | +0.77% | n/a (market-wide) | n/a |
| funding_ge_0.05pct | 1h | 477 | 35 | ride | +0.01% | -0.16% | +0.01% | -0.16 to +0.23 |
| funding_ge_0.05pct | 4h | 477 | 35 | fade | -0.09% | -0.45% | -0.30% | -0.63 to +0.01 |
| funding_ge_0.05pct | 24h | 477 | 35 | ride | +0.49% | -0.65% | -0.79% | -1.86 to +0.15 |
| funding_ge_0.05pct | 72h | 477 | 35 | ride | +2.40% | -0.15% | -2.22% | -4.64 to -0.09 |
| funding_ge_0.05pct | 168h | 477 | 35 | ride | +6.20% | -1.16% | -4.50% | -8.27 to -1.18 |
| gtrends_2x | 1h | 11 | 14 | ride | +0.25% | +0.02% | +0.58% | -0.04 to +1.22 |
| gtrends_2x | 4h | 11 | 14 | ride | +1.65% | +1.19% | +1.31% | +0.11 to +2.58 |
| gtrends_2x | 24h | 11 | 14 | ride | +4.29% | +0.35% | +1.24% | -0.38 to +3.11 |
| gtrends_2x | 72h | 11 | 14 | ride | +6.40% | -3.98% | +0.01% | -4.51 to +3.75 |
| gtrends_2x | 168h | 11 | 14 | ride | +9.78% | +1.41% | -3.28% | -7.71 to +1.40 |
| ls_ratio_top5pct | 1h | 262 | 262 | ride | -0.04% | -0.14% | -0.11% | -0.19 to -0.03 |
| ls_ratio_top5pct | 4h | 262 | 262 | ride | -0.03% | -0.14% | -0.07% | -0.24 to +0.12 |
| ls_ratio_top5pct | 24h | 262 | 262 | ride | +0.57% | +0.18% | -0.02% | -0.47 to +0.41 |
| ls_ratio_top5pct | 72h | 262 | 262 | ride | +0.50% | +0.01% | -0.15% | -0.98 to +0.58 |
| ls_ratio_top5pct | 168h | 262 | 262 | fade | +0.34% | -0.85% | -0.85% | -1.79 to +0.17 |
| oi_24h_up_25pct | 1h | 69 | 70 | fade | -0.12% | -0.49% | -0.47% | -1.01 to +0.04 |
| oi_24h_up_25pct | 4h | 69 | 70 | ride | +0.22% | +0.41% | +0.40% | -0.67 to +1.70 |
| oi_24h_up_25pct | 24h | 69 | 70 | fade | +0.70% | -1.43% | -0.89% | -2.52 to +0.68 |
| oi_24h_up_25pct | 72h | 69 | 70 | ride | +1.19% | +1.91% | +0.44% | -1.61 to +2.15 |
| oi_24h_up_25pct | 168h | 69 | 70 | fade | -0.13% | -5.46% | -2.96% | -5.34 to -0.17 |
| pump_24h_20pct | 1h | 405 | 120 | fade | +0.05% | +0.03% | -0.01% | -0.53 to +0.45 |
| pump_24h_20pct | 4h | 405 | 120 | fade | +0.10% | +0.45% | +0.30% | -0.52 to +1.10 |
| pump_24h_20pct | 24h | 405 | 120 | ride | +0.41% | +1.71% | +1.84% | -1.02 to +5.70 |
| pump_24h_20pct | 72h | 405 | 120 | ride | +2.03% | +1.21% | +0.76% | -1.57 to +3.22 |
| pump_24h_20pct | 168h | 405 | 120 | ride | +5.15% | +0.56% | +0.82% | -1.06 to +2.92 |
| sample_ath_break | 1h | 151 | 151 | ride | +0.13% | -0.18% | -0.02% | -0.23 to +0.19 |
| sample_ath_break | 4h | 151 | 151 | ride | +0.57% | +0.07% | +0.11% | -0.44 to +0.91 |
| sample_ath_break | 24h | 151 | 151 | ride | +0.96% | +1.76% | +1.44% | +0.44 to +2.69 |
| sample_ath_break | 72h | 151 | 151 | ride | +2.57% | +4.18% | +1.53% | -0.28 to +3.73 |
| sample_ath_break | 168h | 151 | 151 | ride | +6.19% | +7.93% | +2.85% | -1.55 to +8.28 |
| taker_buy_spike | 1h | 167 | 343 | fade | -0.05% | -0.09% | -0.05% | -0.14 to +0.04 |
| taker_buy_spike | 4h | 167 | 343 | ride | +0.06% | -0.28% | -0.27% | -0.40 to -0.13 |
| taker_buy_spike | 24h | 167 | 343 | ride | +0.58% | +0.16% | -0.10% | -0.45 to +0.26 |
| taker_buy_spike | 72h | 167 | 343 | ride | +1.84% | +1.91% | +1.25% | -0.09 to +2.87 |
| taker_buy_spike | 168h | 167 | 343 | ride | +3.14% | +1.00% | +0.97% | -0.10 to +1.99 |
| taker_ratio_top5pct | 1h | 905 | 906 | fade | -0.10% | -0.13% | -0.12% | -0.15 to -0.08 |
| taker_ratio_top5pct | 4h | 905 | 906 | fade | -0.06% | -0.19% | -0.13% | -0.19 to -0.07 |
| taker_ratio_top5pct | 24h | 905 | 906 | ride | -0.04% | -0.12% | -0.31% | -0.48 to -0.16 |
| taker_ratio_top5pct | 72h | 905 | 906 | ride | +0.10% | +0.59% | -0.23% | -0.48 to -0.03 |
| taker_ratio_top5pct | 168h | 905 | 906 | ride | +0.24% | +2.59% | -0.04% | -0.34 to +0.24 |
Triggers with fewer than 30 events on one side of 1 July 2025 were split at their median event date instead. Fear and Greed is market wide, so subtracting the basket leaves only the cost.
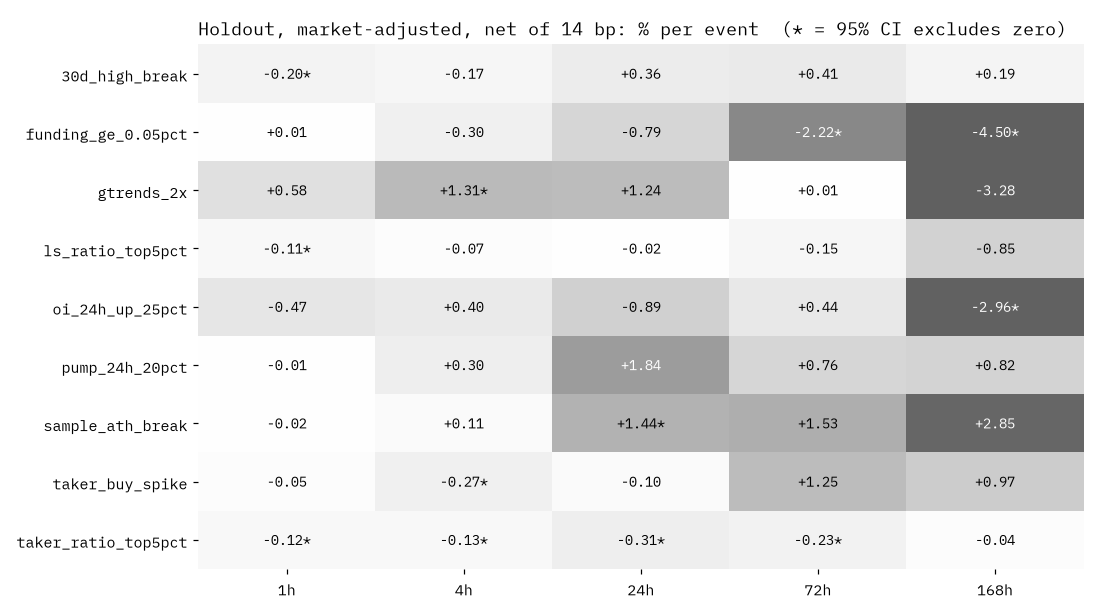
Read the 1-hour and 4-hour columns first, because that is where people chase. Riding a taker-buy spike, a 30-day breakout, or an extreme long/short reading loses money after costs in the holdout, and the interval excludes zero. Chasing in the first hour is a fee donation.
Funding blowouts are the clean failure. In sample, riding them looked best. In the holdout the ride lost 2.2 percent at 72 hours and 4.5 percent at 168 hours against the basket. The rule flipped sign out of sample. Nobody should trade a rule that flips.
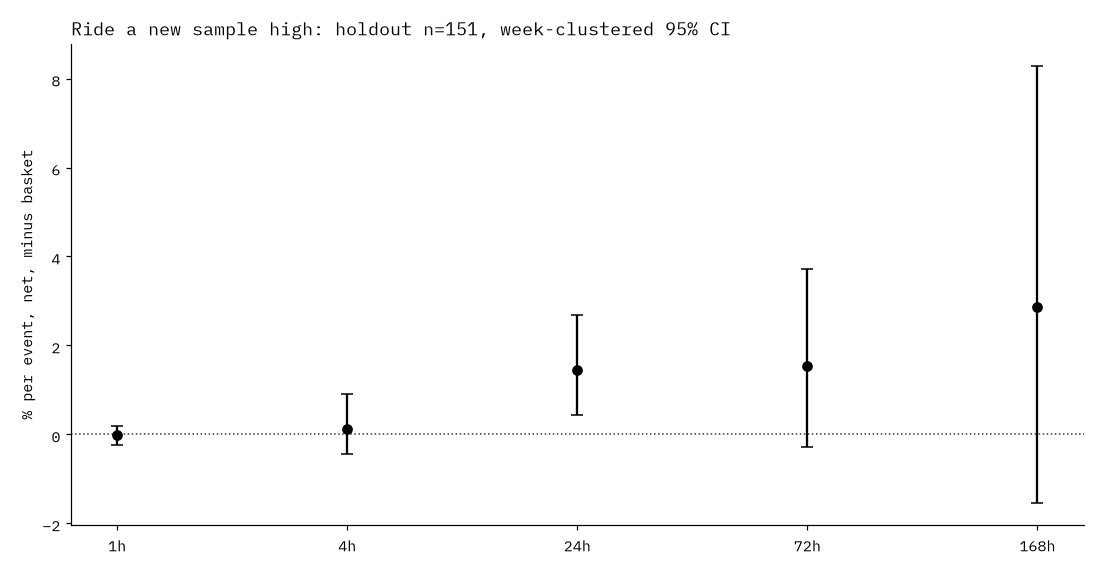
The one survivor is momentum, not FOMO fading: buy a coin printing its highest close since the data starts, hold a day, and it beat the basket by +1.44% net in the holdout. The 72-hour and 168-hour intervals include zero. It is one cell of 45, the sample high is only three years deep, and the holdout spans one cycle. It is a lead to paper trade, not a strategy.
04Meme stocks
trigger = (volume > 5 * median(volume, 50d)) & (day return > 15%)   # GME, AMC since 2018
excess = forward return - SPY forward return| days | n | mean | median | share positive |
|---|---|---|---|---|
| 1 | 35 | +2.4% | -1.8% | 40% |
| 5 | 35 | +12.5% | -2.9% | 46% |
| 20 | 35 | +17.4% | -2.9% | 43% |
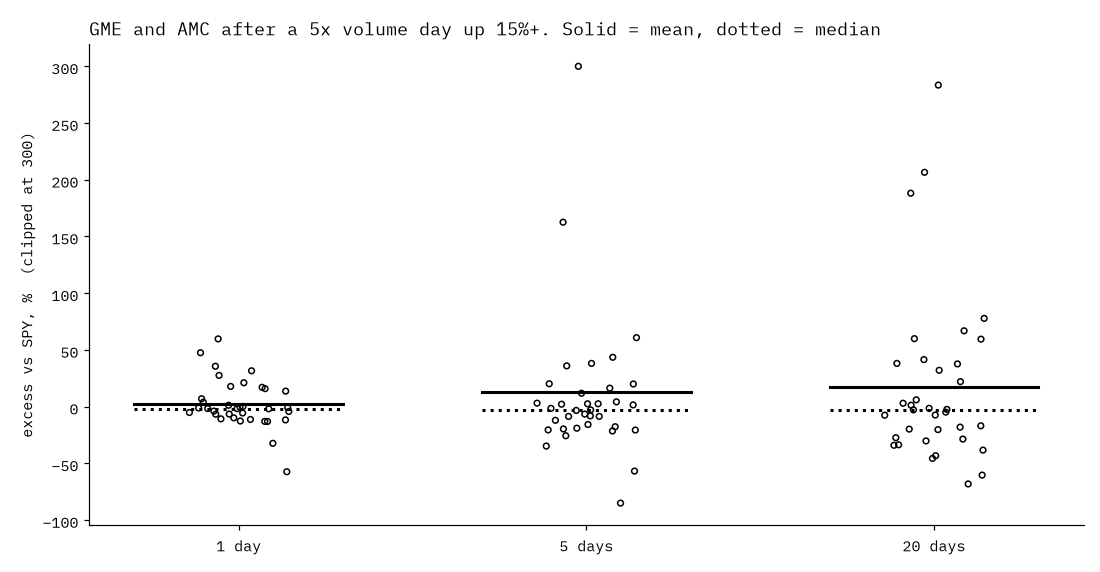
This is the whole FOMO problem in one table. A handful of squeezes drag the average up. The typical chase loses. If you cannot tell the squeeze from the rest in advance, the average is not yours.
05Meme coin launches, sampled at birth
Trending lists only show winners. To avoid that, a collector polled the pump.fun newest-launch feed every few minutes and stored every coin it saw, dead or alive. A random half (by hash of the mint address, fixed at launch) was then pulled for full trade history and 1-minute candles once it was at least an hour old.
cohort = poll("frontend-api-v3.pump.fun/coins?sort=created_timestamp")   # every launch
sample = [c for c in cohort if sha1(c.mint) % 2 == 0 and age(c) >= 1h]
for c in sample: trades(c, cursor=all); candles(c, "1m")527 launches created 2026-10-07 08:37:35 to 2026-10-07 09:20:10 UTC
outcome measured at age >= 1.4h (median 1.4h)| outcome | k | n | rate | 95% Wilson CI |
|---|---|---|---|---|
| any trade | 454 | 527 | 86.15% | 82.94 to 88.84% |
| peak >= $10k | 35 | 527 | 6.64% | 4.81 to 9.10% |
| peak >= $30k | 12 | 527 | 2.28% | 1.31 to 3.94% |
| peak >= $100k | 6 | 527 | 1.14% | 0.52 to 2.46% |
| peak >= $1M | 3 | 527 | 0.57% | 0.19 to 1.66% |
| graduated | 12 | 527 | 2.28% | 1.31 to 3.94% |
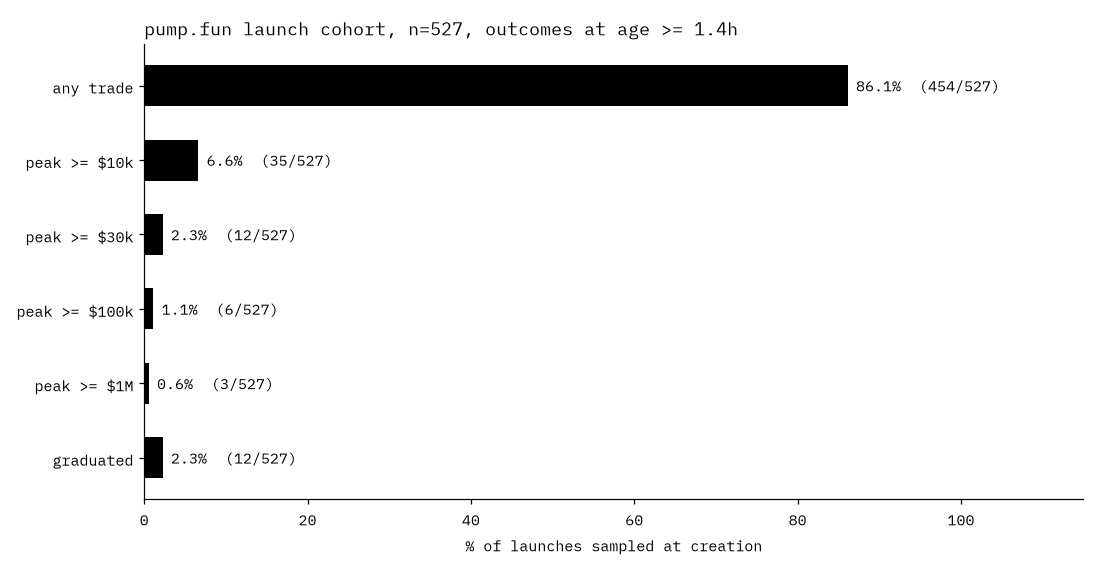
The peak is almost always at the start. Median time to the peak was 0.0 minutes; 93% of tokens peaked inside 5 minutes and 98% inside 15. That matches the Solidus Labs finding that 98.6 percent of pump.fun tokens from January 2024 to March 2025 fell under 1,000 dollars of liquidity.
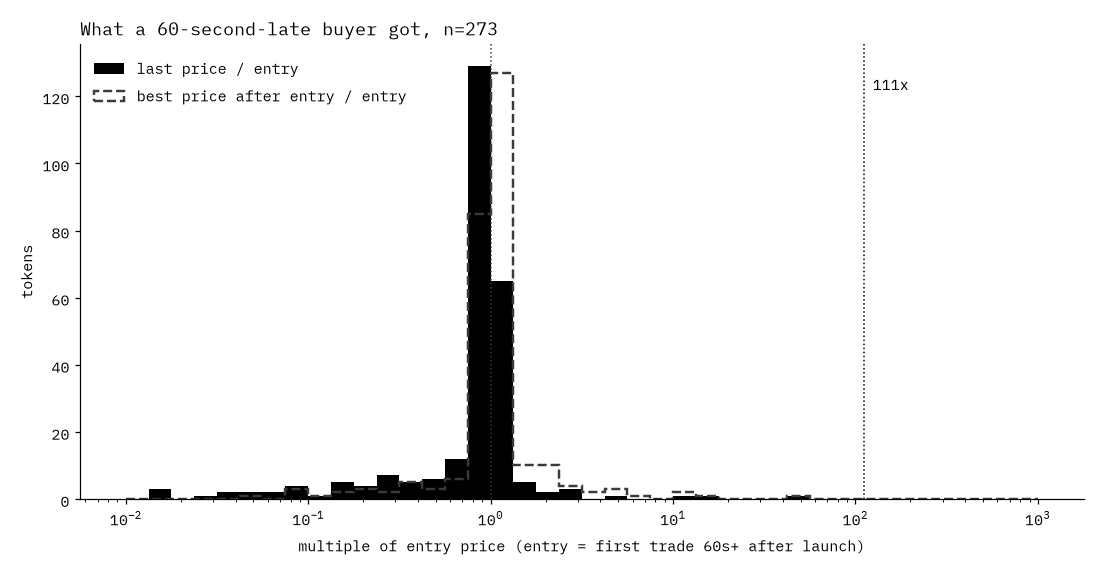
entry = first trade >= 60s after creation      # a fast human, not a bot
fee = 0.03                                      # estimate: platform fee + priority fee + slippage
take_2x_else_hold = 2*(1-fee) if peak_after_entry >= 2*entry else last/entry*(1-fee)entries 273
median last / entry 0.99
mean last / entry 1.10
take 2x else hold, mean 0.882
hold, mean / median 1.070 / 0.964| outcome | k | n | rate | 95% CI |
|---|---|---|---|---|
| peak>=2x entry | 19 | 273 | 7.0% | 4.5 to 10.6% |
| peak>=10x | 4 | 273 | 1.5% | 0.6 to 3.7% |
| peak>=100x | 0 | 273 | 0.0% | 0.0 to 1.4% |
| peak>=111x | 0 | 273 | 0.0% | 0.0 to 1.4% |
| last<=0.5x entry | 50 | 273 | 18.3% | 14.2 to 23.3% |
06The three things that make a good meme coin
The usual list has three parts: a strong meme or narrative, a real community with a social presence, and clean launch mechanics (fair liquidity, holders spread out, no dev bundle or sniper cluster). Narrative strength has no honest number, so the only proxy here is crowding: whether the ticker copies another launch in the same window. The other two are tested directly with launch-time data.
| feature | n | peak >= $30k | peak >= $100k |
|---|---|---|---|
| twitter: none | 219 | 0.9% | 0.5% |
| twitter: profile | 111 | 7.2% | 3.6% |
| twitter: status link | 191 | 1.0% | 0.5% |
| twitter: community | 0 | n/a | n/a |
| website: yes | 219 | 5.0% | 2.7% |
| website: no | 308 | 0.3% | 0.0% |
| telegram: yes | 11 | 9.1% | 0.0% |
| all three socials | 5 | 20.0% | 0.0% |
| creator serial (>=3 launches in sample) | 276 | 0.4% | 0.0% |
| creator single launch | 219 | 5.0% | 2.7% |
| ticker duplicated in sample | 315 | 1.6% | 0.3% |
| dev buy >= 1 SOL | 89 | 4.5% | 3.4% |
| dev buy < 0.1 SOL | 235 | 3.4% | 1.3% |
| dev sold within 10 min | 353 | 1.4% | 0.3% |
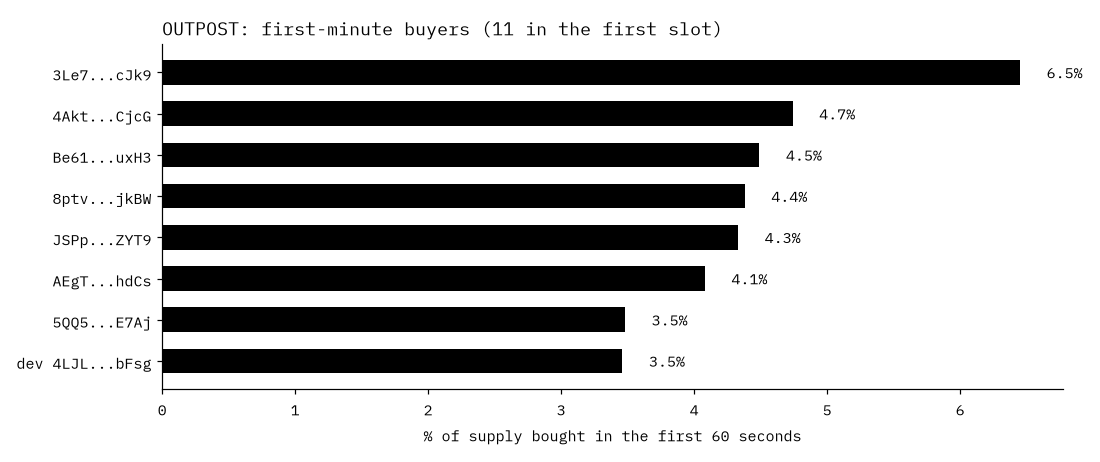
| >=3 buyers in first slot (bundle proxy) | 90 | 8.9% | 3.3% |
| >=10 buyers first 60s | 80 | 10.0% | 3.8% |
| top early wallet >=5% supply | 167 | 4.2% | 1.8% |
Bundle proxy: three or more distinct wallets buying in the first slot. Early features use only trades from the first 60 seconds, so they are known before the 60-second entry.
Social presence and launch hygiene did sort launches. Every 100k peak came from a creator with fewer than three launches in the window and a website in the metadata. An X link to a profile beat an X link to a single post. Mechanics went the other way from the folklore: first-slot bundles and heavy early wallets showed up more often on the coins that ran, not less. Snipers and bundlers go where the attention is. That makes them a warning about who you are paying, not a sign the coin will fail.
The caveat is size. There are six 100k peaks in total and 17 features were tested, so none of these gaps would clear a strict multiple-testing bar. Treat them as filters to test, not as signals.
07What the trenchers actually do
positions = ledger(trades)   # per wallet per token: SOL in, SOL out, unsold bag
# a bag over 2% of supply is valued at zero (no exit liquidity); smaller bags at the last print
closed = positions[sold_all & ~token.isin([runner, manufactured_cap])]wallets 13,359
positions in the one runner 24% of all positions
closed positions, runner removed 8,923
in profit 38%
sum -15.5 SOL
creator positions, runner removed 417: +33.4 SOL, 59% in profit
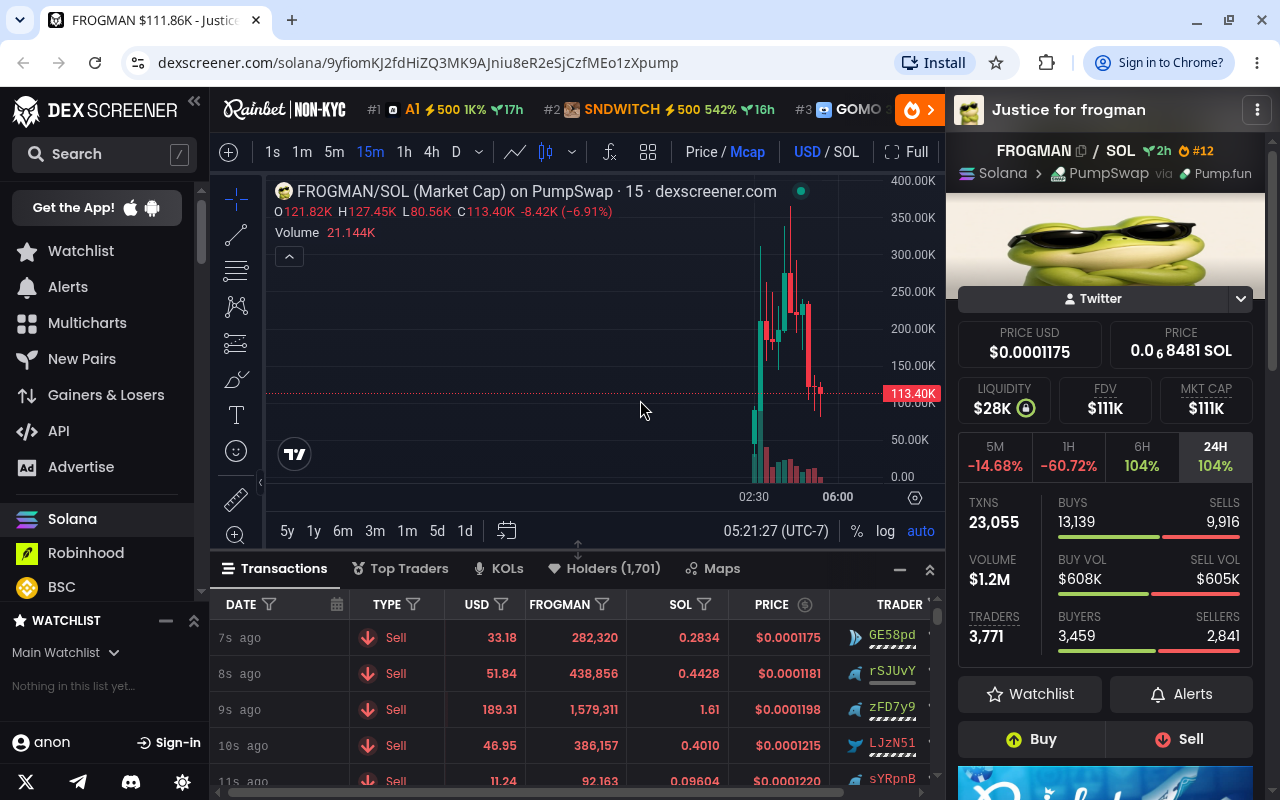
kolscan wallets seen in sample 8One token, the FROGMAN runner in the case files, carried 24% of every wallet position in the cohort. Any wallet-level average that includes it is mostly a statement about that one coin. The table below removes it, along with the manufactured-cap launch, and counts only positions the wallet fully sold, so no mark-to-market flatters the result.
| entry delay | positions | mean PnL | sum PnL | in profit |
|---|---|---|---|---|
| 0-2s | 1330 | +0.267 | +355.1 | 44% |
| 2-10s | 822 | +0.142 | +117.1 | 40% |
| 10-60s | 1578 | -0.015 | -24.3 | 42% |
| 1-10m | 3491 | -0.114 | -399.0 | 30% |
| >10m | 1702 | -0.038 | -64.4 | 47% |
Measured. Realized only: SOL out minus SOL in, positions the wallet fully exited.
Speed is the edge. Wallets in the first 10 seconds made money as a group. From 1 to 10 minutes, the window where a person sees a coin on a feed and clicks, positions lost the most and won least often. That bucket is the exit liquidity.
The public leaderboards say the same thing from the other side. On kolscan, which tracks self-identified KOL wallets, the 30-day top 50 lost more trades than they won.
| window | 50th place | median | first | median win rate | win rate under 50% | median trades |
|---|---|---|---|---|---|---|
| 1 day | 18 | 48 | 602 | 43% | 54% | 27 |
| 7 day | 82 | 152 | 1502 | 43% | 64% | 212 |
| 30 day | 295 | 602 | 3055 | 34% | 72% | 1375 |
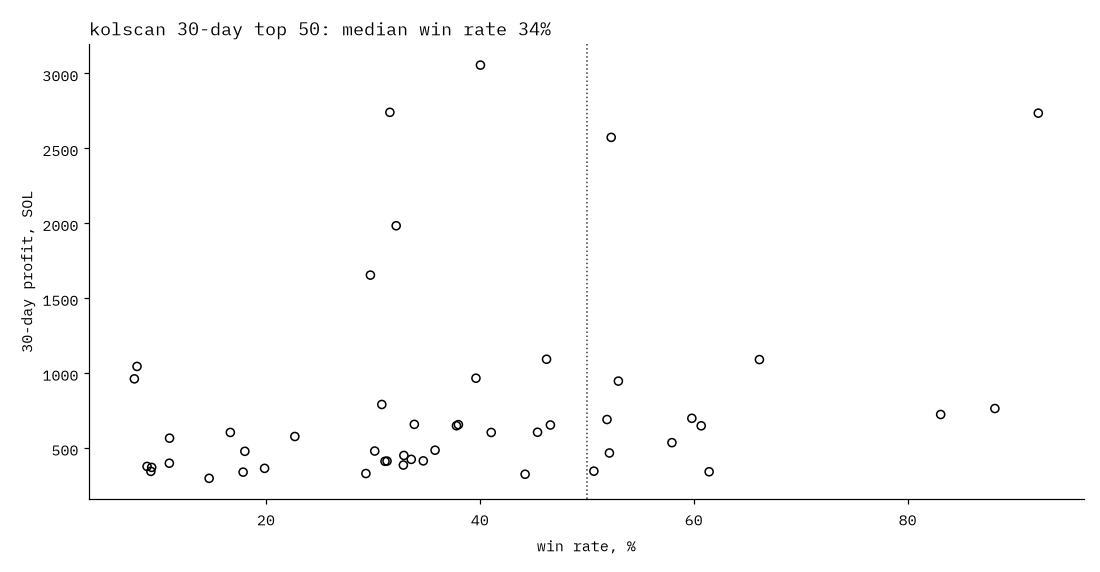
Three things make copying them worse than it looks. They are influencers whose calls move price, so a follower buys their exit. They are on a leaderboard because they won recently, so the list is survivorship by construction (21 of the 1-day top 50 were also in the 30-day top 50). And the edge is time: a copy-trade bot fills seconds later, and the table above shows what seconds are worth.
08Case files: five real launches and five real wallets
Every example below comes from the sampled cohort, chosen by a rule rather than by eye: the highest peak overall (a manufactured one), the highest peak where no wallet bought half the supply at launch, the biggest peak that then lost over 80% after the creator sold, the launch with the most first-slot buyers, and the best run from the most-copied ticker. Addresses are complete so you can check them yourself.
The winner: FROGMAN
case("winner") # mint 9yfiomKJ2fdHiZQ3MK9AJniu8eR2eSjCzfMEo1zXpumpcreated 2026-10-07 08:58:54 UTC
creator DjM7...uN7s launches in window: 1
ticker copies 10
website / X link yes / yes
dev buy 11.50 SOL
first-slot buyers 9
peak (1m close) $287,602 at 56.1 min
last print $238,077
trades 20780 graduated: yes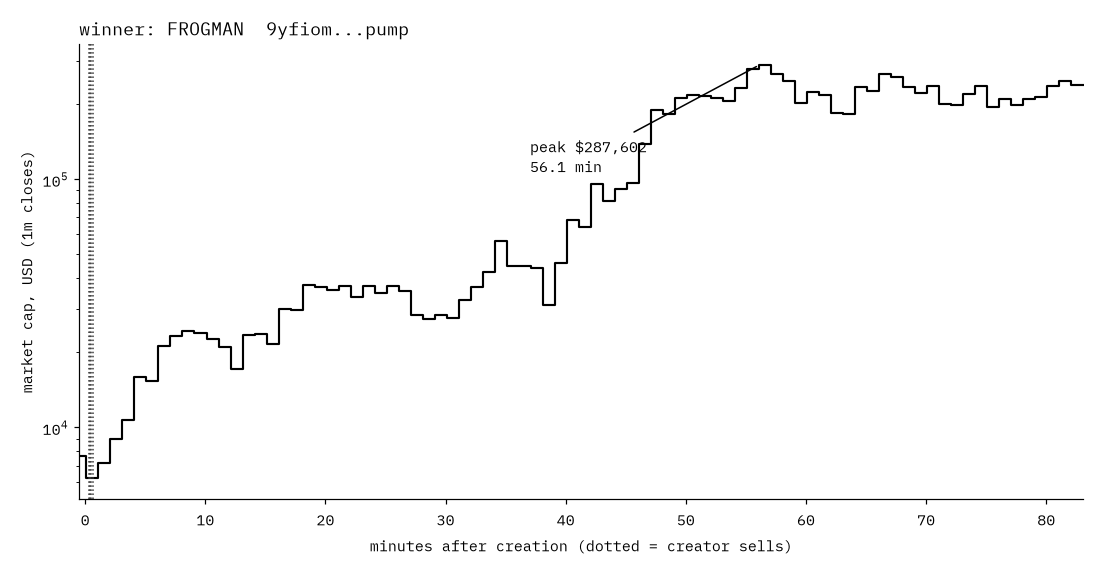
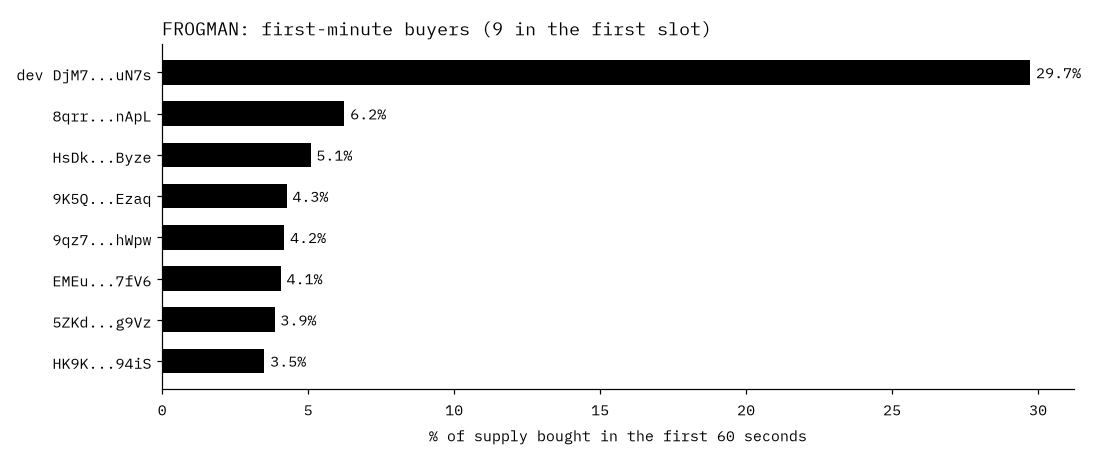
| minute | side | SOL |
|---|---|---|
| 0.00 | buy | 11.496 |
| 0.33 | sell | 7.932 |
| 0.42 | sell | 4.061 |
| 0.50 | sell | 2.184 |
| 0.62 | sell | 2.101 |
The manufactured market cap: TDF
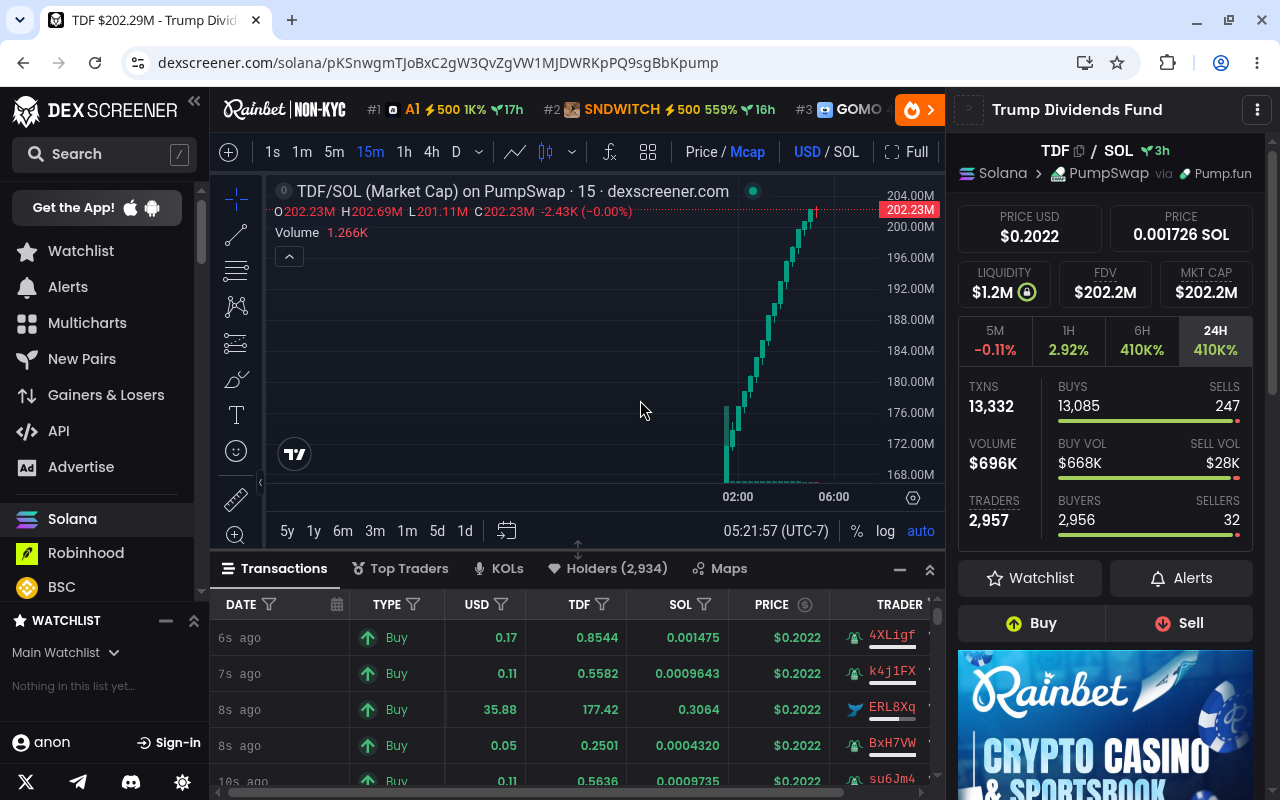
case("fakecap") # mint pKSnwgmTJoBxC2gW3QvZgVW1MJDWRKpPQ9sgBbKpumpcreated 2026-10-07 08:42:13 UTC
creator FQjn...e4tb launches in window: 1
ticker copies 1
website / X link yes / no
dev buy 85.01 SOL
first-slot buyers 3
peak (1m close) $183,987,281 at 84.8 min
last print $183,801,699
trades 7691 graduated: yes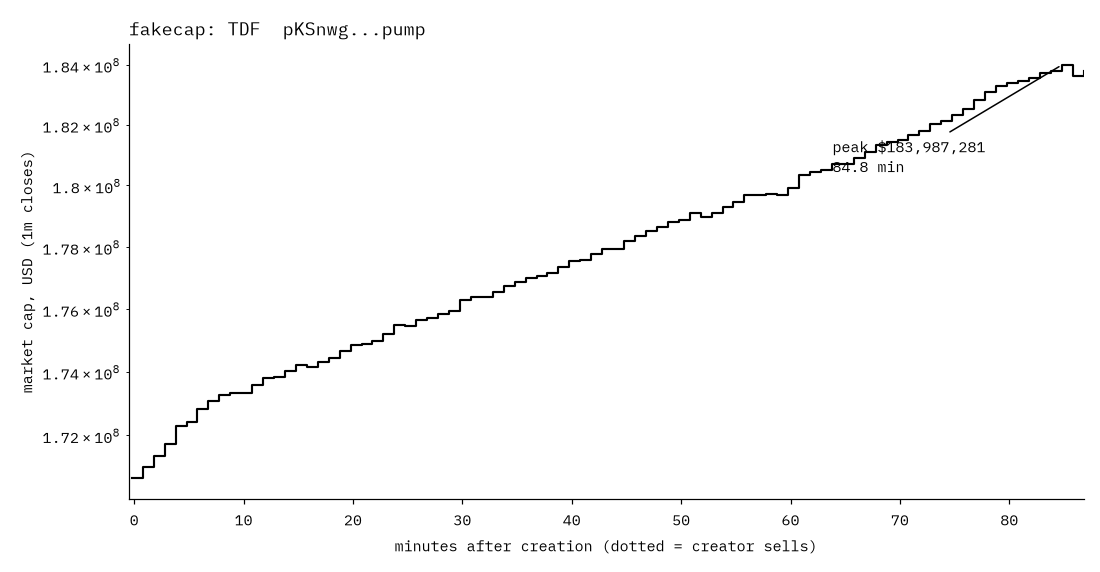
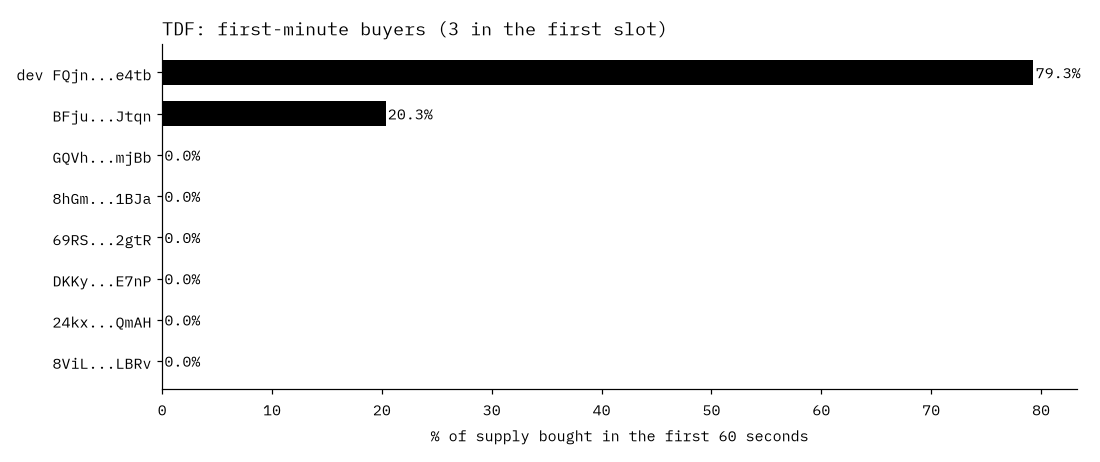
| minute | side | SOL |
|---|---|---|
| 0.00 | buy | 85.005 |
The rug: whalesword
case("rug") # mint BsLqUzZGvCwD3f4JBRQs3zqj3DqwtSwJbYVb2fRFpumpcreated 2026-10-07 08:59:15 UTC
creator 9tW6...dP2f launches in window: 1
ticker copies 1
website / X link yes / yes
dev buy 0.10 SOL
first-slot buyers 5
peak (1m close) $58,959 at 0.0 min
last print $2,683
trades 551 graduated: yes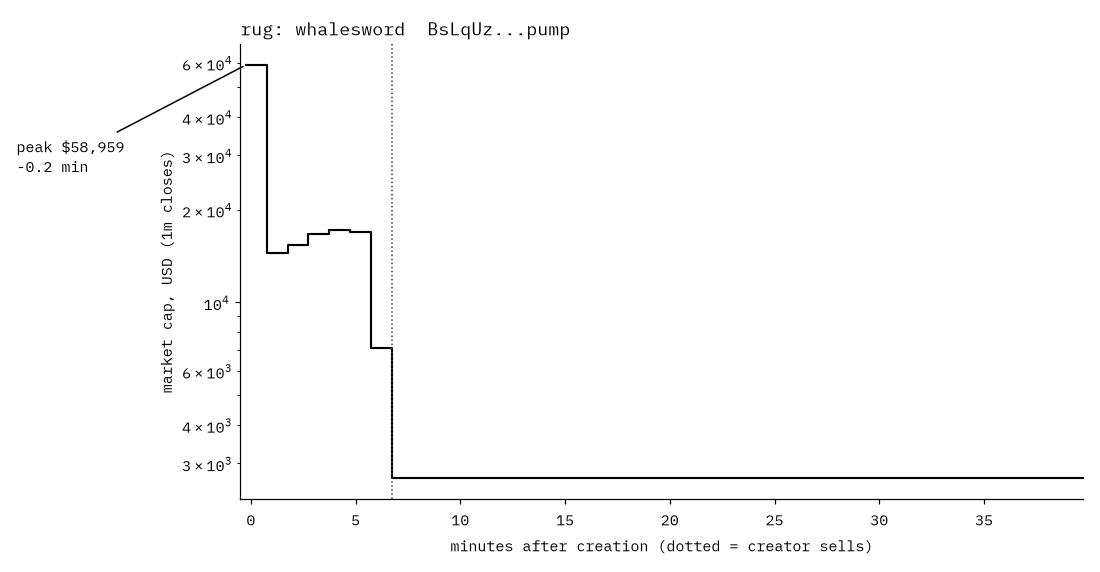
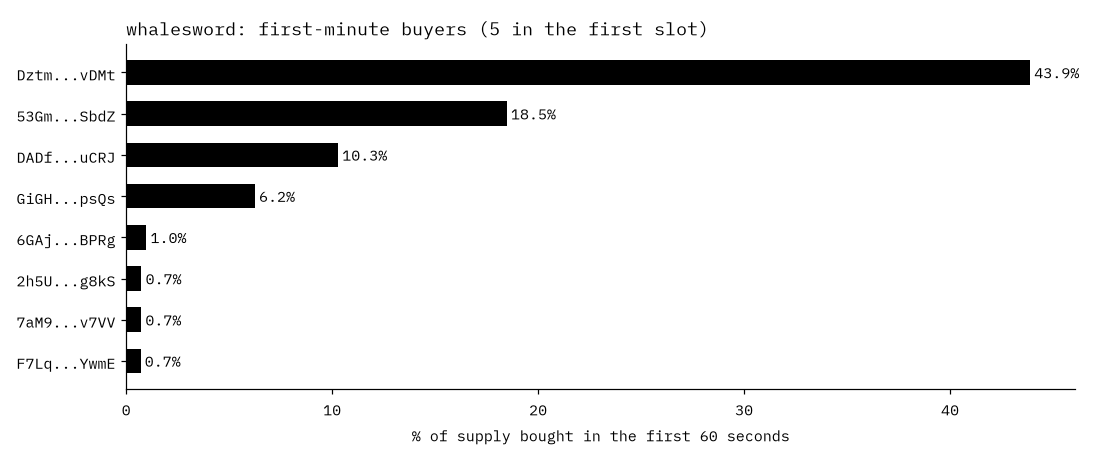
| minute | side | SOL |
|---|---|---|
| 0.00 | buy | 0.099 |
| 6.73 | sell | 0.085 |
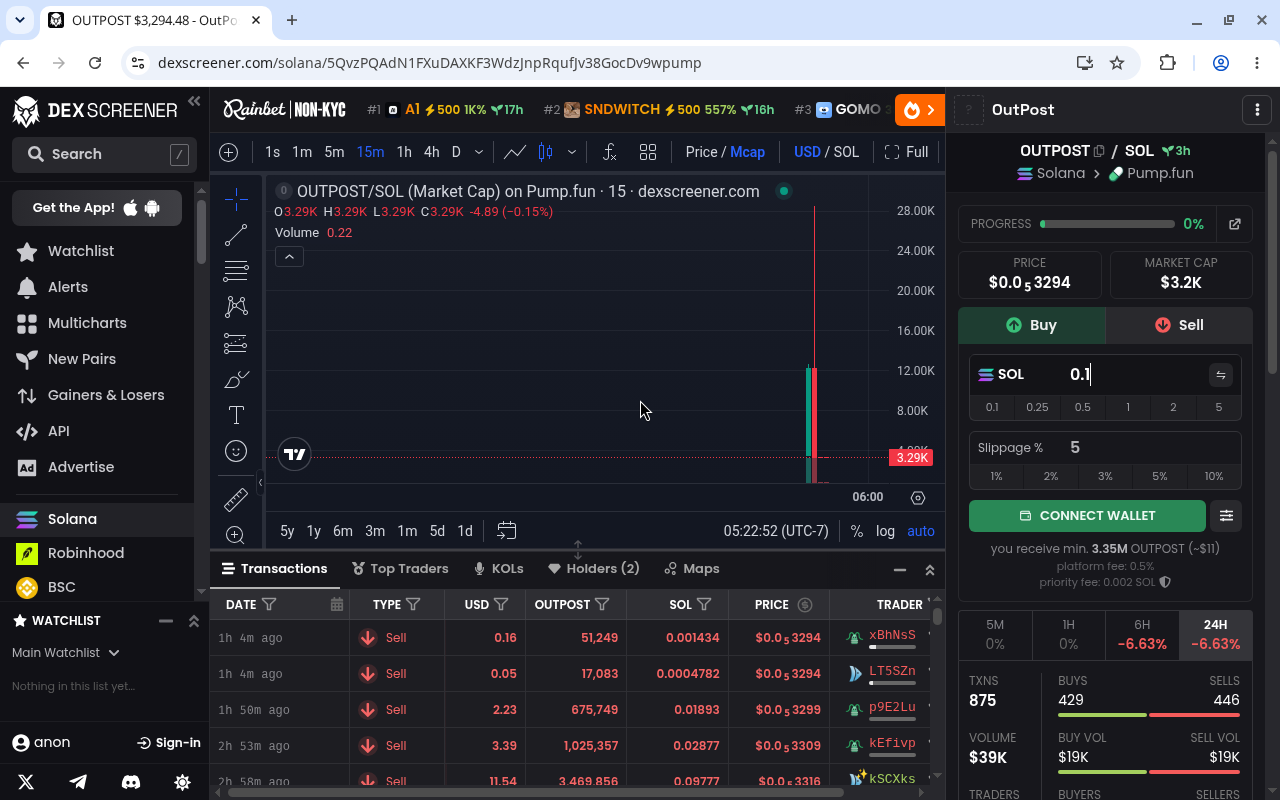
The bundle: OUTPOST
case("bundle") # mint 5QvzPQAdN1FXuDAXKF3WdzJnpRqufJv38GocDv9wpumpcreated 2026-10-07 09:13:23 UTC
creator 4LJL...bFsg launches in window: 1
ticker copies 3
website / X link yes / yes
dev buy 1.00 SOL
first-slot buyers 11
peak (1m close) $18,489 at 1.6 min
last print $3,299
trades 882 graduated: no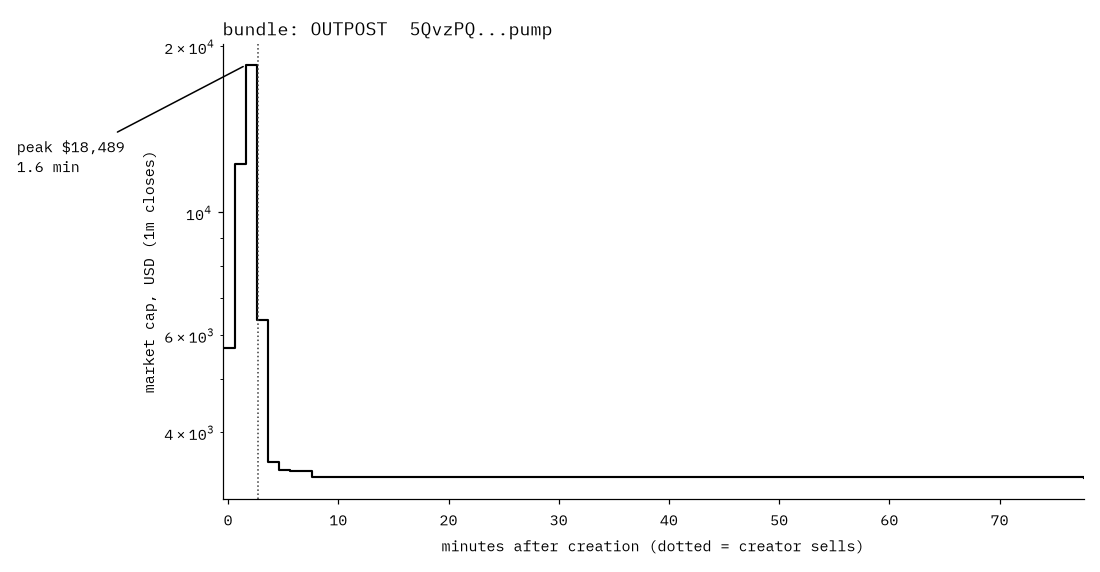
| minute | side | SOL |
|---|---|---|
| 0.00 | buy | 1.000 |
| 2.73 | sell | 5.676 |
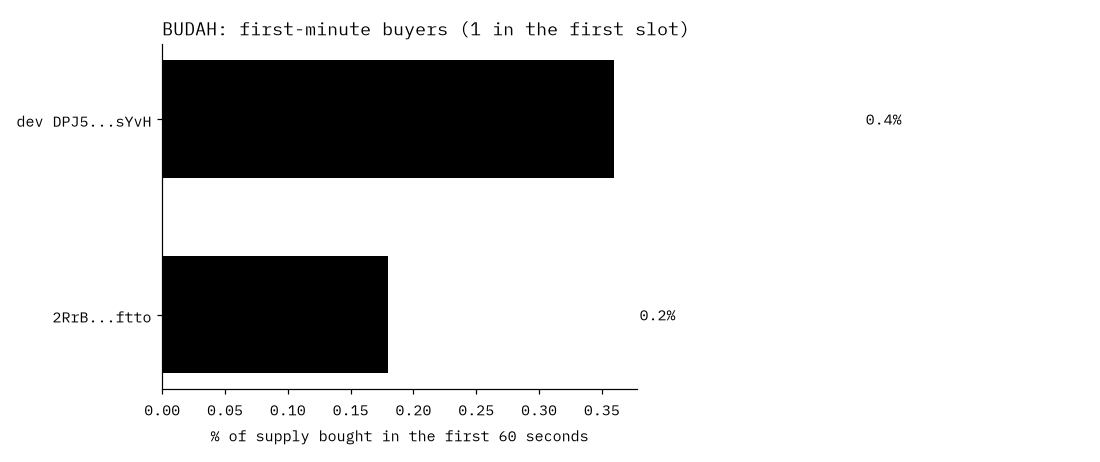
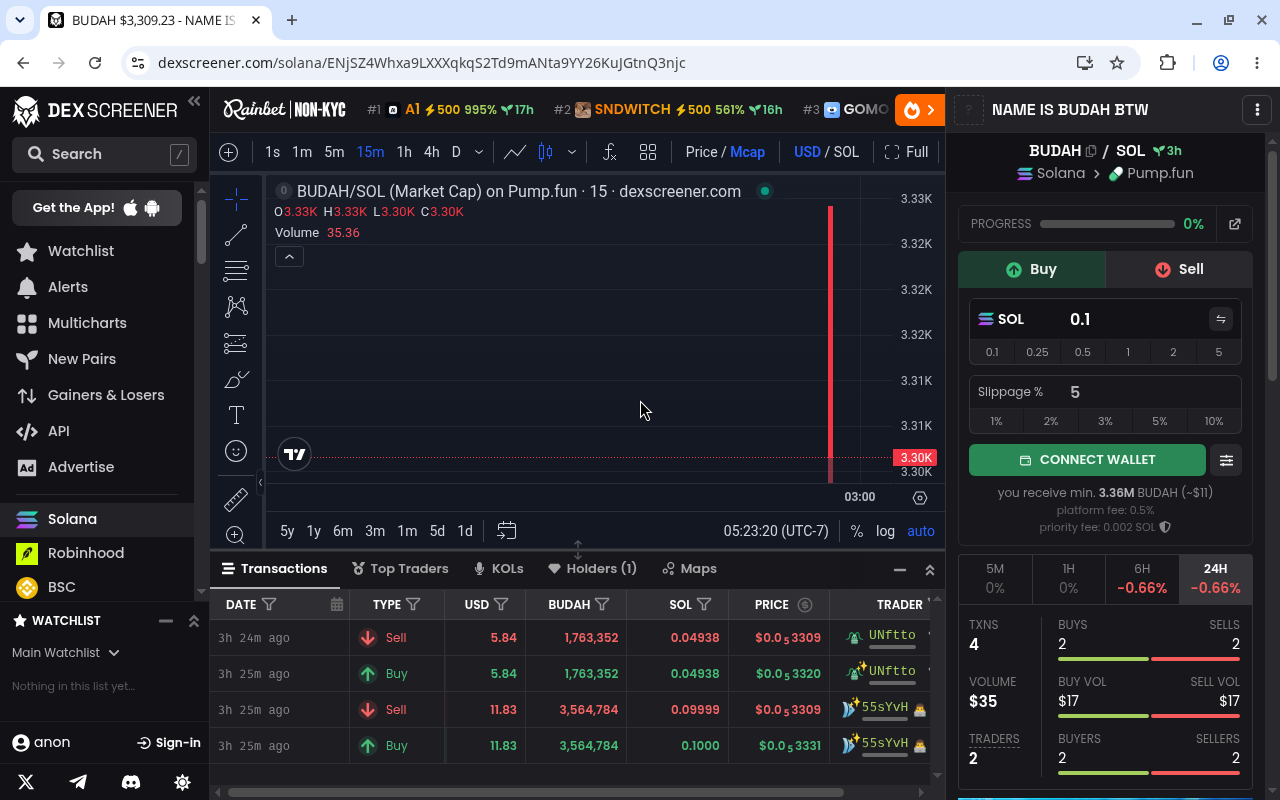
The vamp clone: BUDAH
case("vamp") # mint ENjSZ4Whxa9LXXXqkqS2Td9mANta9YY26KuJGtnQ3njccreated 2026-10-07 08:57:32 UTC
creator DPJ5...sYvH launches in window: 3
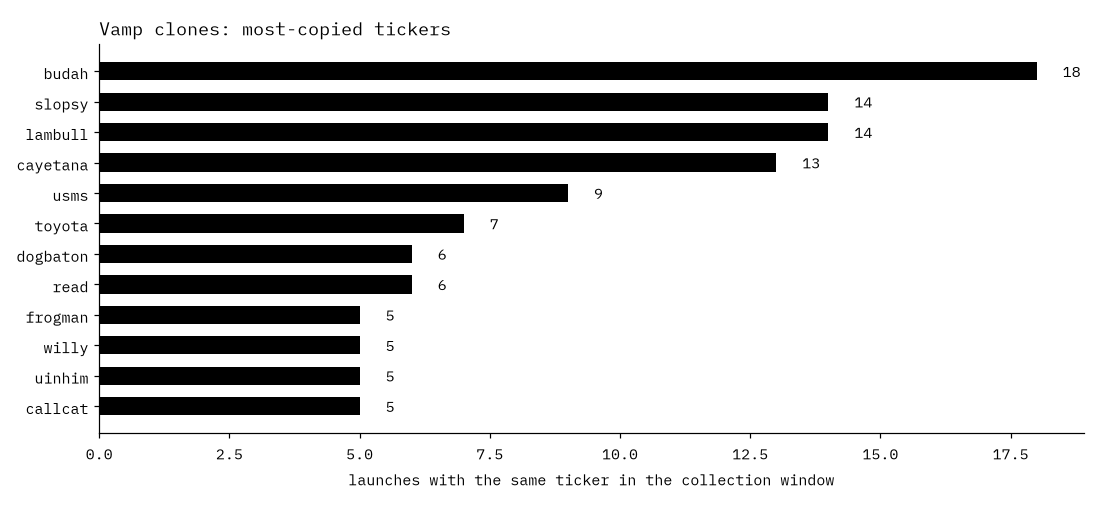
ticker copies 39
website / X link yes / yes
dev buy 0.10 SOL
first-slot buyers 1
peak (1m close) $3,317 at 0.0 min
last print $3,305
trades 4 graduated: no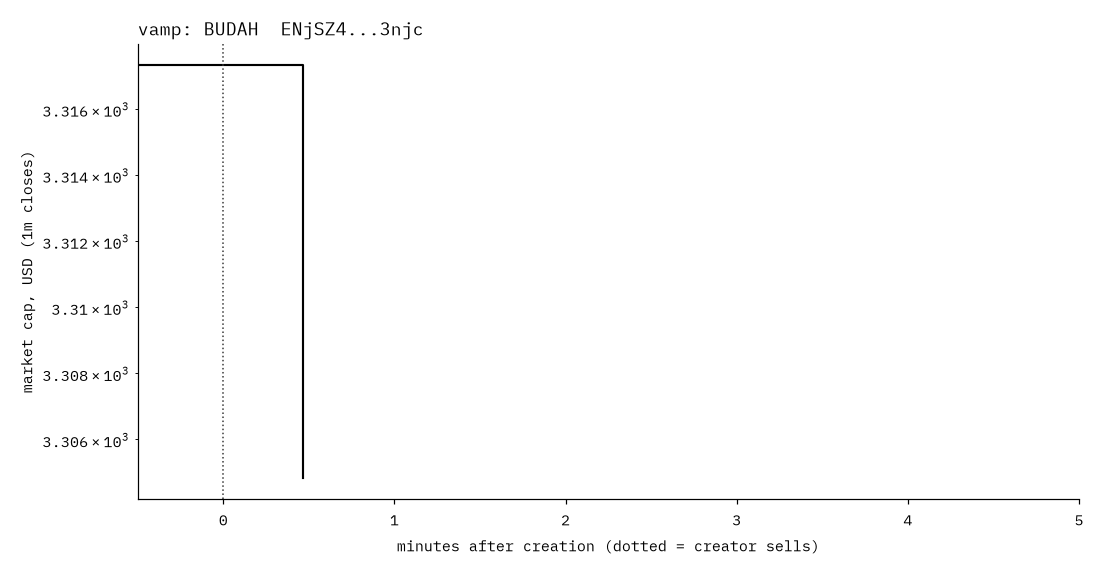
| minute | side | SOL |
|---|---|---|
| 0.00 | buy | 0.100 |
| 0.00 | sell | 0.100 |
Five wallets, trade by trade
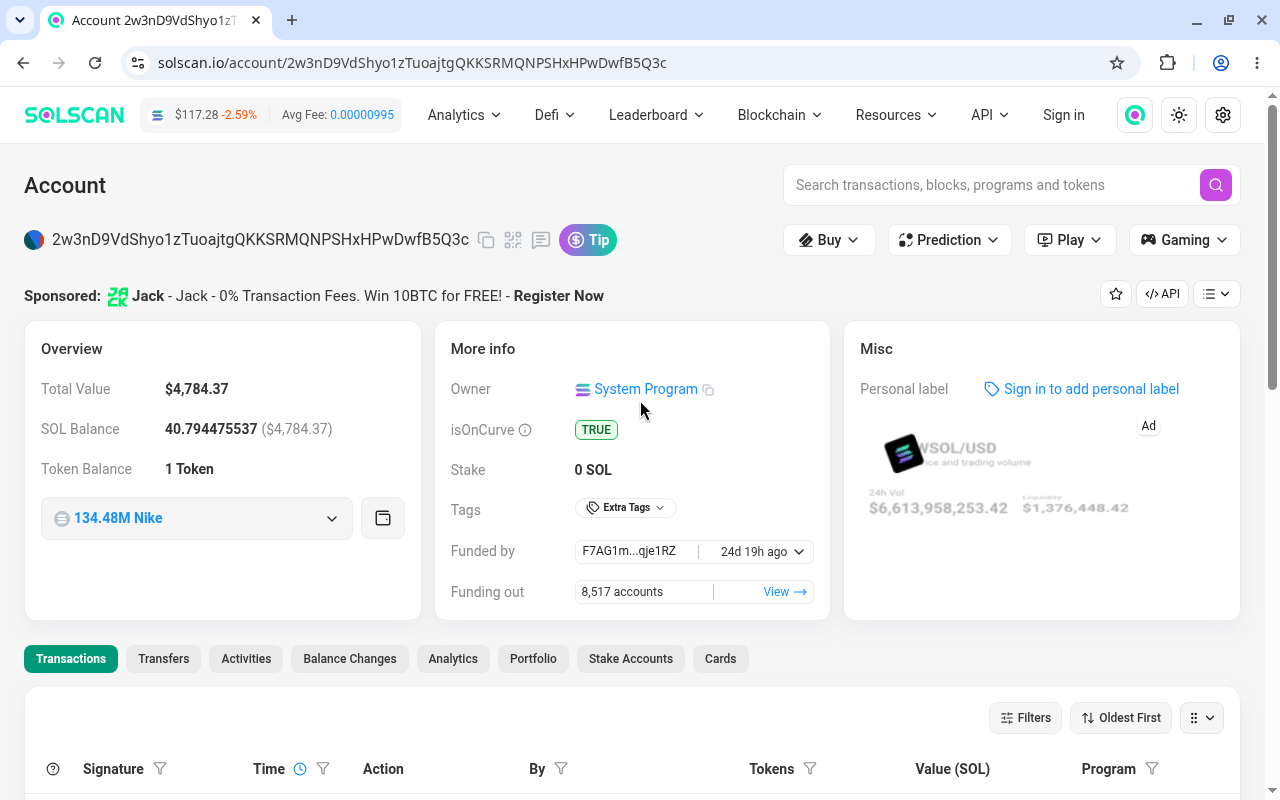
| wallet | PnL | tokens | wins | creator? | median entry s | median hold min | best trade |
|---|---|---|---|---|---|---|---|
| 2w3n...5Q3c | +118.92 | 1 | 1 | no | 0.0 | 27.23 | Apple +118.92 |
| Cb4f...ckrr | +72.28 | 2 | 1 | no | 105.5 | 47.34 | FROGMAN +72.43 |
| 8MaV...88D5 | +62.52 | 4 | 3 | no | 389.5 | 3.08 | FROGMAN +61.61 |
| GAVq...rRa8 | +58.43 | 1 | 1 | no | 977.0 | 41.27 | FROGMAN +58.43 |
| 6Sne...VKd5 | +50.69 | 1 | 1 | no | 391.0 | 45.23 | FROGMAN +50.69 |
09The free playbook: what held up and what did not
Paid alpha groups sell calls, and a call is exit liquidity for whoever made it. This section gives the checks away for free, with the number behind each one. All rates come from the 527launch cohort (273 had a 60-second entry). It is one morning of launches and in-sample, so test before you believe.
Flags at launch, measured
| flag | 100k peaks, flag | 100k peaks, no flag | 30k peaks, flag | 30k peaks, no flag |
|---|---|---|---|---|
| Serial launcher | 0 of 276 | 6 of 251 | 1 of 276 | 11 of 251 |
| Vamp clone (ticker 2+ times) | 1 of 315 | 5 of 212 | 5 of 315 | 7 of 212 |
| No website | 0 of 308 | 6 of 219 | 1 of 308 | 11 of 219 |
| No X link | 1 of 219 | 5 of 308 | 2 of 219 | 10 of 308 |
| X link is a single post, not a profile | 1 of 191 | 5 of 336 | 2 of 191 | 10 of 336 |
| Dev sold inside 10 min (after the fact) | 1 of 353 | 5 of 174 | 5 of 353 | 7 of 174 |
| 3+ buyers in first slot | 3 of 90 | 3 of 437 | 8 of 90 | 4 of 437 |
| One wallet 5%+ in first 60s | 3 of 167 | 3 of 360 | 7 of 167 | 5 of 360 |
Measured. Serial launchers, clones and missing websites almost never ran. First-slot bundles and heavy early wallets showed up more often on coins that did run: they follow attention.
How to see these without code: the pump.fun coin page shows the creator, the trade feed and the holder list. Solscan shows the creator's launch history and where its SOL came from. Most trading apps show first-block buyers and top-holder share. If the dev and the top early holders were funded by the same address seconds apart, it is one person with many wallets. That last check is standard practice, not something measured here.
Entry and exit rules, measured
| filter | sample | entries | hold | take 2x else hold | take 3x else hold | 100k peak rate |
|---|---|---|---|---|---|---|
| none | all | 273 | 1.070 | 0.882 | 0.901 | 2.2% |
| none | without the runner | 271 | 0.922 | 0.878 | 0.893 | 1.5% |
| not serial, not a clone | all | 77 | 0.866 | 0.887 | 0.866 | 6.5% |
| not serial, not a clone | without the runner | 76 | 0.863 | 0.885 | 0.863 | 5.3% |
| not serial, not a clone, has website | all | 33 | 0.789 | 0.848 | 0.789 | 15.2% |
| not serial, not a clone, has website | without the runner | 32 | 0.781 | 0.841 | 0.781 | 12.5% |
| fails one of those | all | 196 | 1.150 | 0.880 | 0.915 | 0.5% |
| fails one of those | without the runner | 195 | 0.944 | 0.875 | 0.905 | 0.0% |
A multiple below 1.000 loses money. Without the one runner, every filter and every exit rule loses.
This is the most useful table on the page, and it is a failure. The filters work at what they claim to do: they raise the share of coins that reach 100k by an order of magnitude. They do not make a 60-second-late buyer profitable. Without the single runner, every row is below 1. Holding is only positive in the full sample because one coin, held to the end, outweighs everything else, and you would have had to own it and not sell.
What you can copy and what you cannot
| behavior | can you copy it by hand? | evidence |
|---|---|---|
| Buy in the first 10 seconds | No: it takes bots and paid block space | closed positions 0-10s were the only profitable buckets |
| Launch coins and sell into buyers | No, and it is the extraction | creator positions +33.4 SOL, 59% in profit (runner removed) |
| Skip serial launchers, clones, no-website coins | Yes | 100k peaks: 0 of 276 serial, 1 of 315 clones, 0 of 308 without a website |
| Lose most trades, win big on a few | Yes, if sized small | kolscan 30-day median win rate 34% |
| Hold the one runner | Only by luck at a 60s entry | 24% of all positions were in one coin |
Pre-trade checklist
- The creator has not launched 3+ coins in the last hour or two.
- The ticker is not a copy of something launched in the last hour.
- A website exists and the X link is a profile, not a single post.
- You know who the first-slot buyers and big early wallets are, because you are their exit.
- The dev and early holders were not funded by the same address.
- The stake is money you expect to lose: 1 to 2% of a trading bankroll is a rule of thumb, not a backtest.
- The trade gets logged. If 200 logged trades do not beat a 1.0 multiple after fees, stop.
10Can 100 become 10,000?
100 to 10,000 is a 100x. 1,000 to 111,000 is a 111x. In this cohort, 0 of 273 late entries touched 111x their entry price at the best 1-minute close (upper 95 percent bound 1.4%). 4 of 273 touched 10x and 7% touched 2x. Touching is not selling. Chaining two 10x trades at that touch rate is worse than a 1 in 4,000 path, before fees.
The screenshots are real and they are a selection. Tens of thousands of launches a day produce a few spectacular wallets by chance alone, and the wallets that repeat are mostly first-second buyers with infrastructure. That is a business, not a trade a retail buyer can copy. A realistic goal for 100 dollars in the trenches is to lose it slowly enough to learn something.
11Verdict
- Chasing liquid FOMO in the first hours loses after costs. Published as a failure.
- Riding funding blowouts flipped sign out of sample. Published as a failure.
- Riding a new sample high for 24 hours survived one holdout at +1.44% market-adjusted. Paper trade only.
- Launch filters (no serial launcher, no clone, a website) raise the odds of a 100k coin about tenfold. No filter or exit rule made a 60-second entry profitable once the one runner was removed. Published as a failure.
- Realized profit sits with wallets in the first 10 seconds. The 1-to-10-minute window, where people click, loses the most.
12Limits
The launch cohort covers launches from a single early morning UTC window and a horizon of hours. A slower meme that runs on day three is missed. X follower counts and account age were not available. Wallet PnL ignores fees paid outside the trade record and marks unsold bags with a haircut. Perp costs are estimates at the base fee tier. The metrics-based triggers have only 240 days of data.
13Sources
- Binance public data archive, data.binance.vision.
- Fear and Greed Index, alternative.me.
- pump.fun public frontend and swap APIs, polled 7 Oct 2026.
- kolscan leaderboard, kolscan.io.
- Solidus Labs, Solana rug pulls and pump-and-dumps, report.
- Chainalysis, crypto market manipulation 2025, blog.